XRP Historical Data Shows A Recurring Boom and Bust Cycle
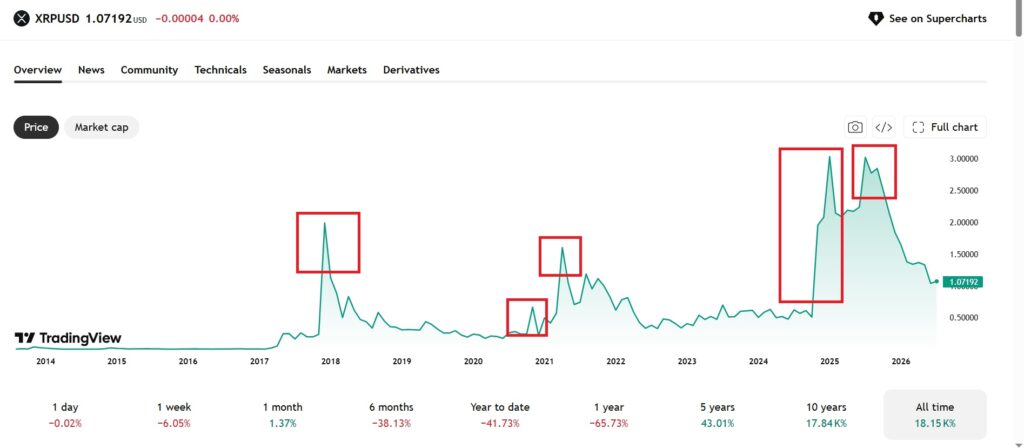
XRP has only seen five major bull rallies in twelve years, and history shows that steep drops usually follow every spike.
 XRPcoinbeat.news
XRP/USD live chart
LIVEXRP has a long history of volatile price swings. Since its launch in 2014, the token has experienced just five significant bull rallies. While these periods saw the price jump by over 100 percent, they were consistently followed by sharp corrections that erased nearly 80 percent of those gains. This cycle has defined the asset for more than a decade.
Data indicates that whenever XRP pushes past key levels like 1.50 dollars or 2 dollars, it eventually retreats to much lower support zones. For example, previous surges above 3 dollars were followed by deep pullbacks to around 1.10 dollars. This pattern suggests the token often struggles to maintain momentum after a breakout, frequently landing back near its starting price.
Currently, XRP appears to be repeating this historical playbook. After hitting an all time high of 3.65 dollars last year, the price has dropped significantly. With the broader market stalling and Bitcoin caught in a tight trading range, XRP is now facing pressure to hold its position above the 1 dollar mark. Investors are watching closely to see if it can stabilize or if another dip toward 0.90 dollars is on the horizon.
Prices update live from CoinMarketCap. Market data, not financial advice.
Market sentiment
Be the first to react
▍Comments (0)
No comments yet. Start the conversation!