Ethereum Price Analysis: Double Three Pattern Hints at Rally
Ethereum is testing key resistance at $2,500 as traders watch a specific technical pattern for signs of a new trend.

 ETHcoinbeat.news
ETH/USD live chart
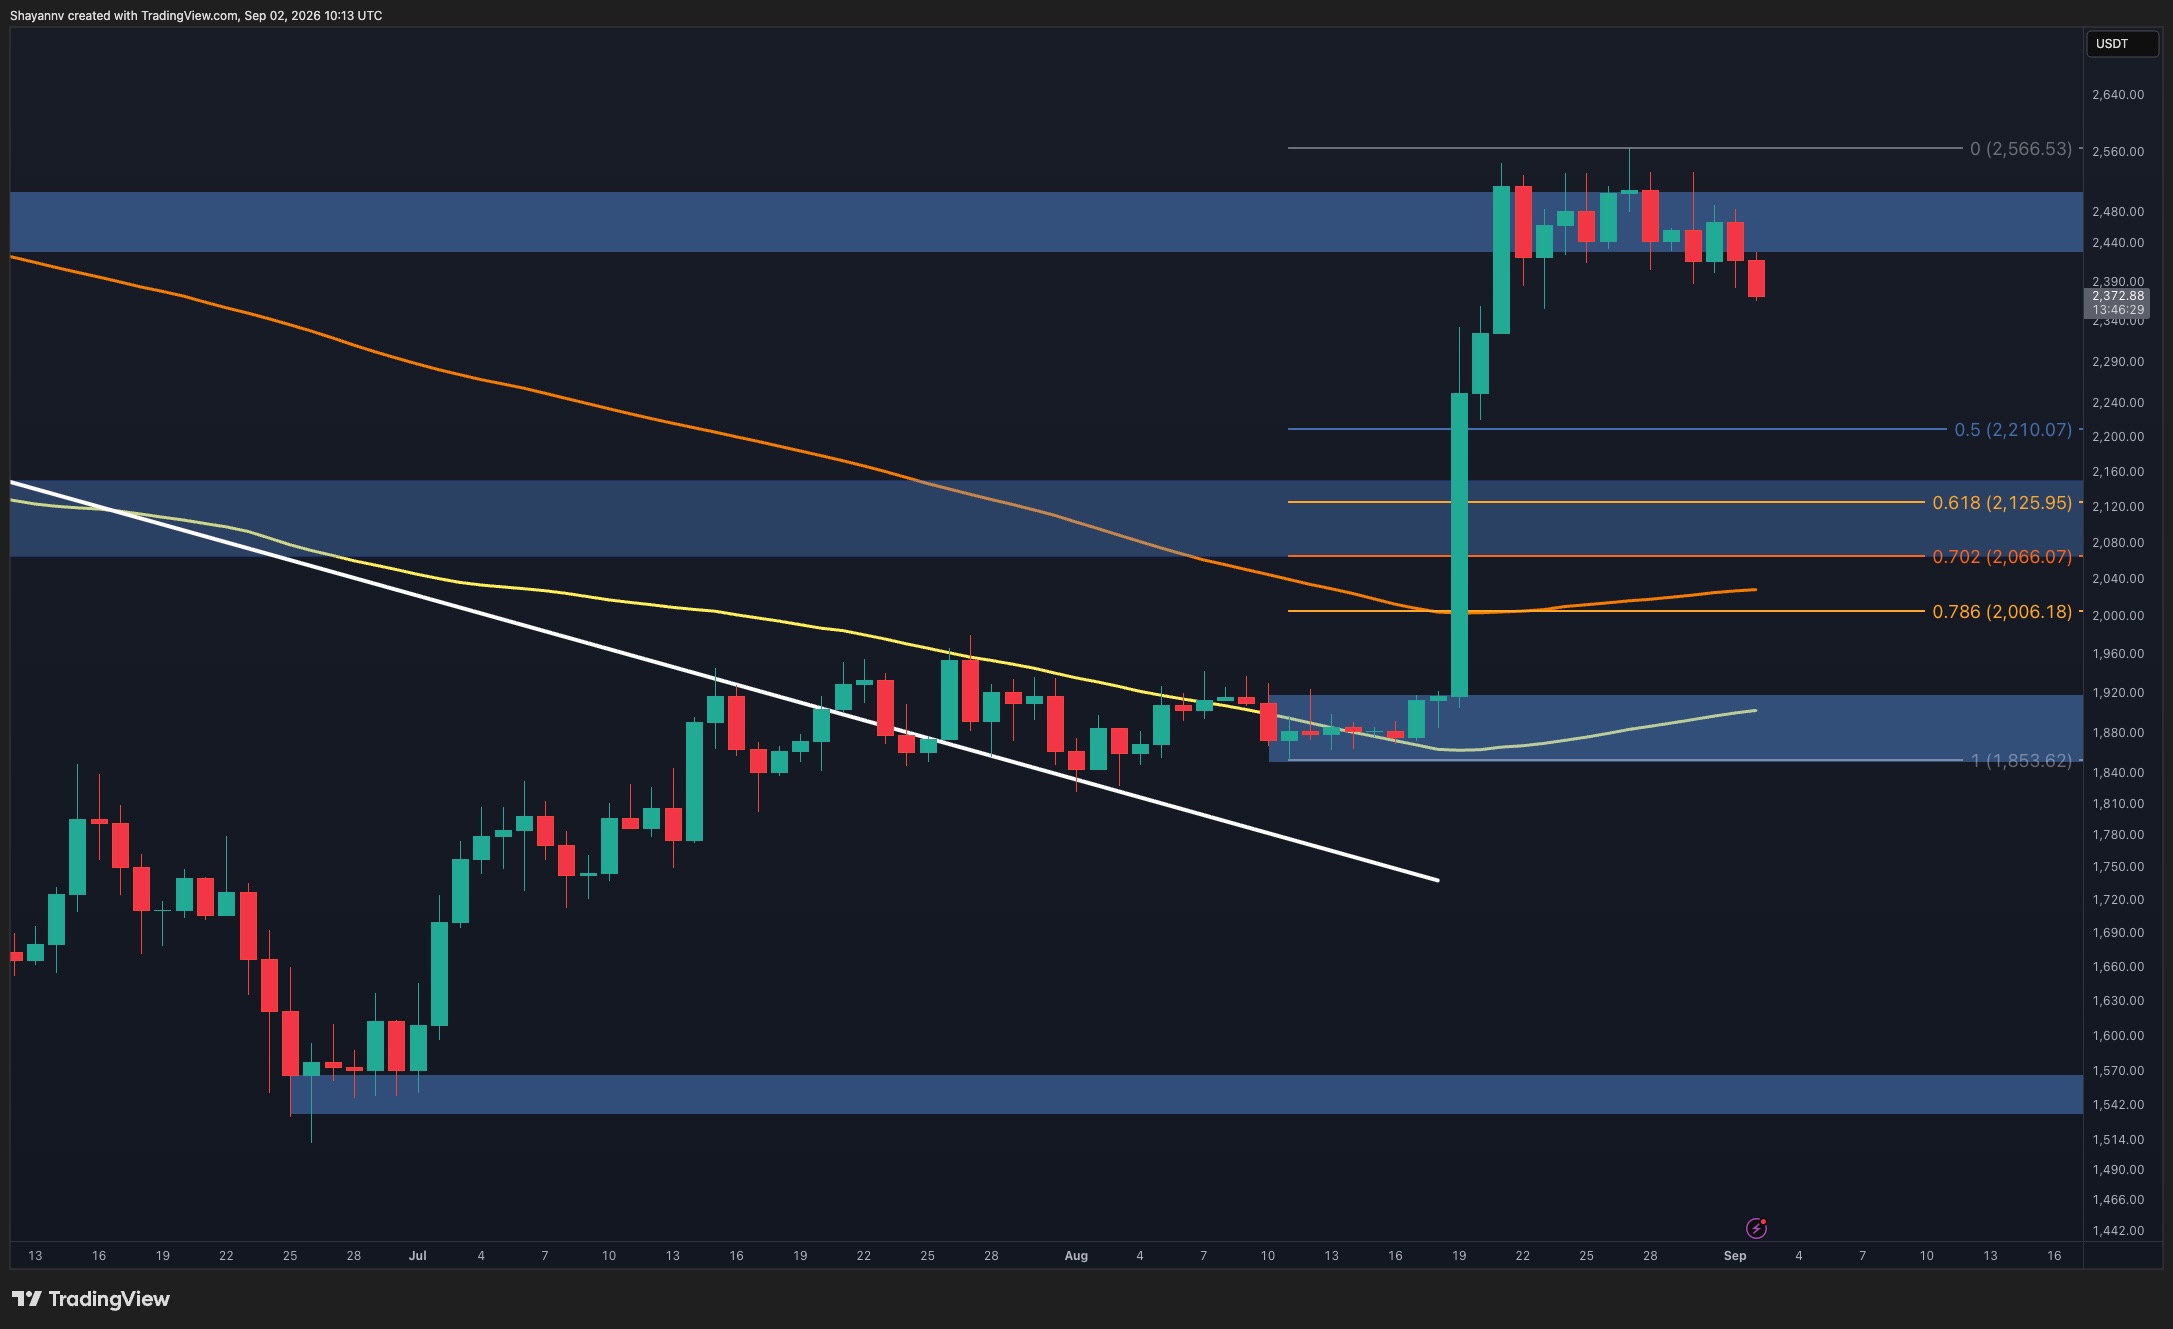
LIVEEthereum is currently trading around $2,520, a level that has become a critical pivot point for market participants. The coin recently completed an Elliott Wave Double Three correction, a structure that helped define a clear support zone for buyers. This technical setup, often identified by traders as a W, X, Y sequence, successfully brought buyers into the market near the $2,375 area, allowing the price to stabilize.
Looking at the broader chart, the asset has spent the last few days moving between $2,490 and $2,525. This narrow range suggests a period of consolidation. Whether the price can turn the $2,500 to $2,550 band into support will likely dictate the direction of the next major move. If bulls manage to break above this resistance, targets of $2,700 and potentially $3,000 become possible.
However, the market remains cautious. A failure to hold the $2,438 Fibonacci support level could signal a drop toward the 200 day moving average near $2,161. While technical analysis provides a framework for these moves, traders should keep in mind that these patterns are based on probabilities rather than certainties. The coming days will be key in seeing if Ethereum can maintain its current momentum or if it will fall back to lower support levels.
Prices update live from CoinMarketCap. Market data, not financial advice.
Market sentiment
Be the first to react
▍Comments (0)
No comments yet. Start the conversation!