Bitcoin Price Struggles to Break Key Resistance Levels
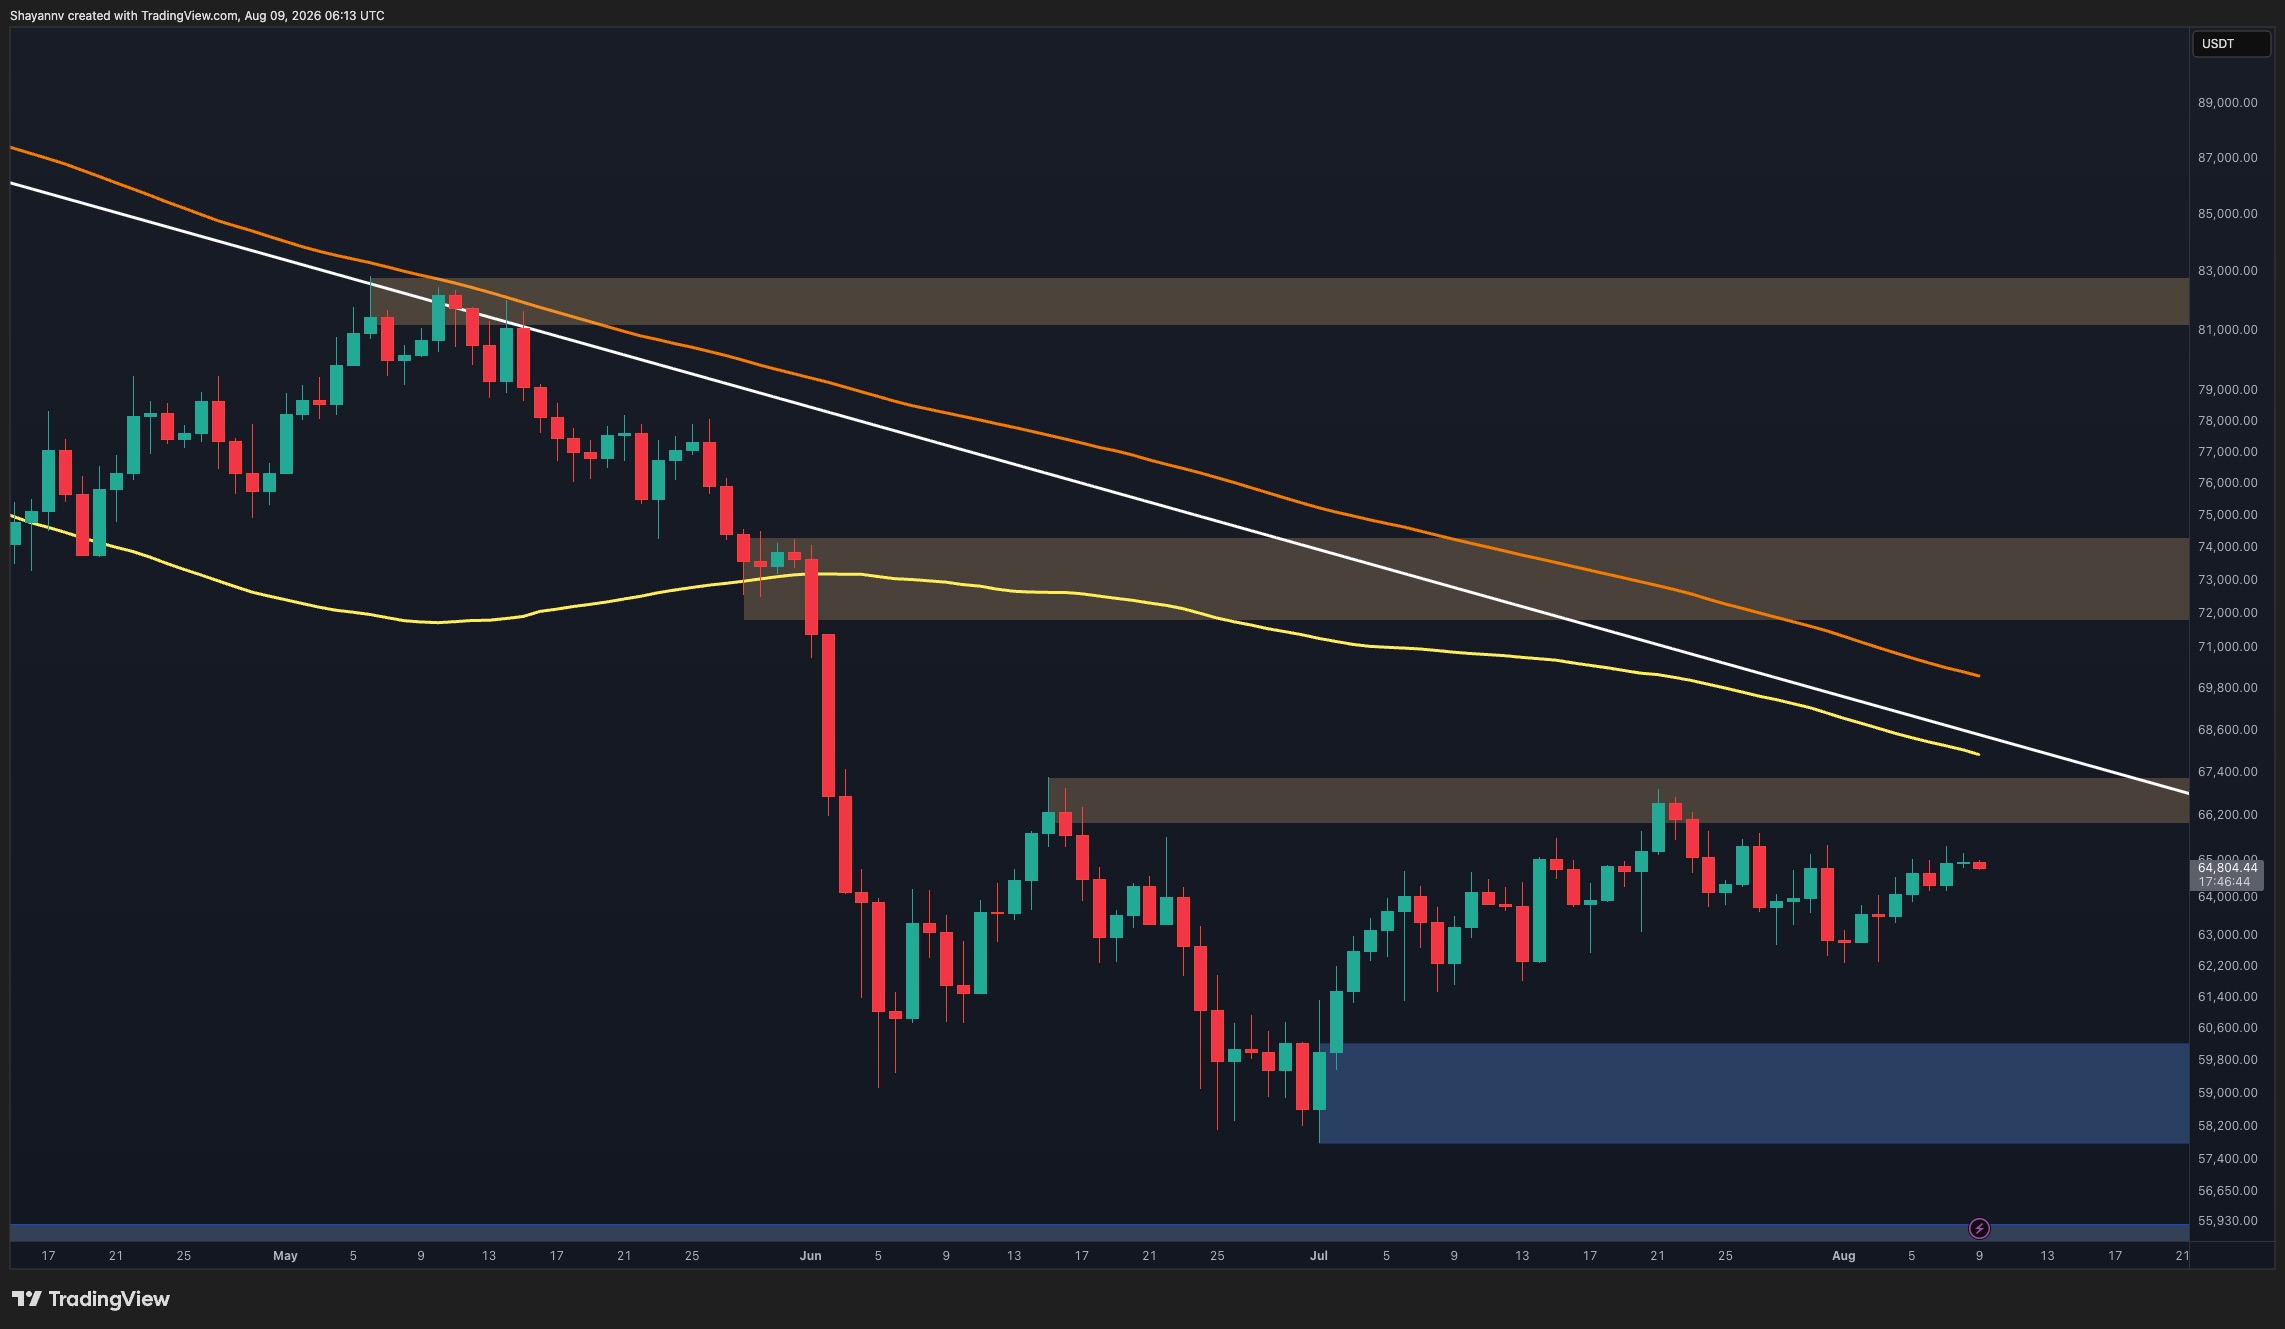
Bitcoin is stuck in a consolidation pattern as traders wait for a clear direction amidst heavy overhead resistance.
 BTCcoinbeat.news
BTC/USD live chart
LIVEBitcoin is currently trading near $65,000, but the recent recovery lacks the strength needed to spark a new bull run. The price is hitting a wall around the $65,800 to $66,800 resistance zone. Until buyers can push the price past this point and clear the downward trendline, the market remains tilted toward a bearish outlook.
On the 4 hour chart, the situation looks even tighter. Bitcoin has tried to reclaim the $64,800 to $65,400 range multiple times but keeps falling short. If it cannot hold above this area, we may see another slide back toward the $61,800 support zone. Traders should watch these levels closely for signs of a breakout or another rejection.
Data from on chain metrics shows that many recent buyers are currently holding at an unrealized loss. The realized price for those who bought in the last one to three months sits at $67,000. Because these investors are underwater, they may look to sell if the price reaches their entry point, creating further resistance for any potential rally.
Outside of the charts, the market is keeping a close eye on global events. Rising geopolitical tensions and upcoming inflation reports in the United States could spark sudden price swings. For now, Bitcoin is in a waiting game, and volatility will likely continue until a definitive move confirms the next trend.
Prices update live from CoinMarketCap. Market data, not financial advice.
Market sentiment
Be the first to react
▍Comments (0)
No comments yet. Start the conversation!