Bitcoin Price Analysis: Is the Current Rally a Bull Trap?
Bitcoin struggles to break past key resistance levels as traders weigh whether this recovery is a genuine reversal or a temporary trap.
 BTCcoinbeat.news
BTC/USD live chart
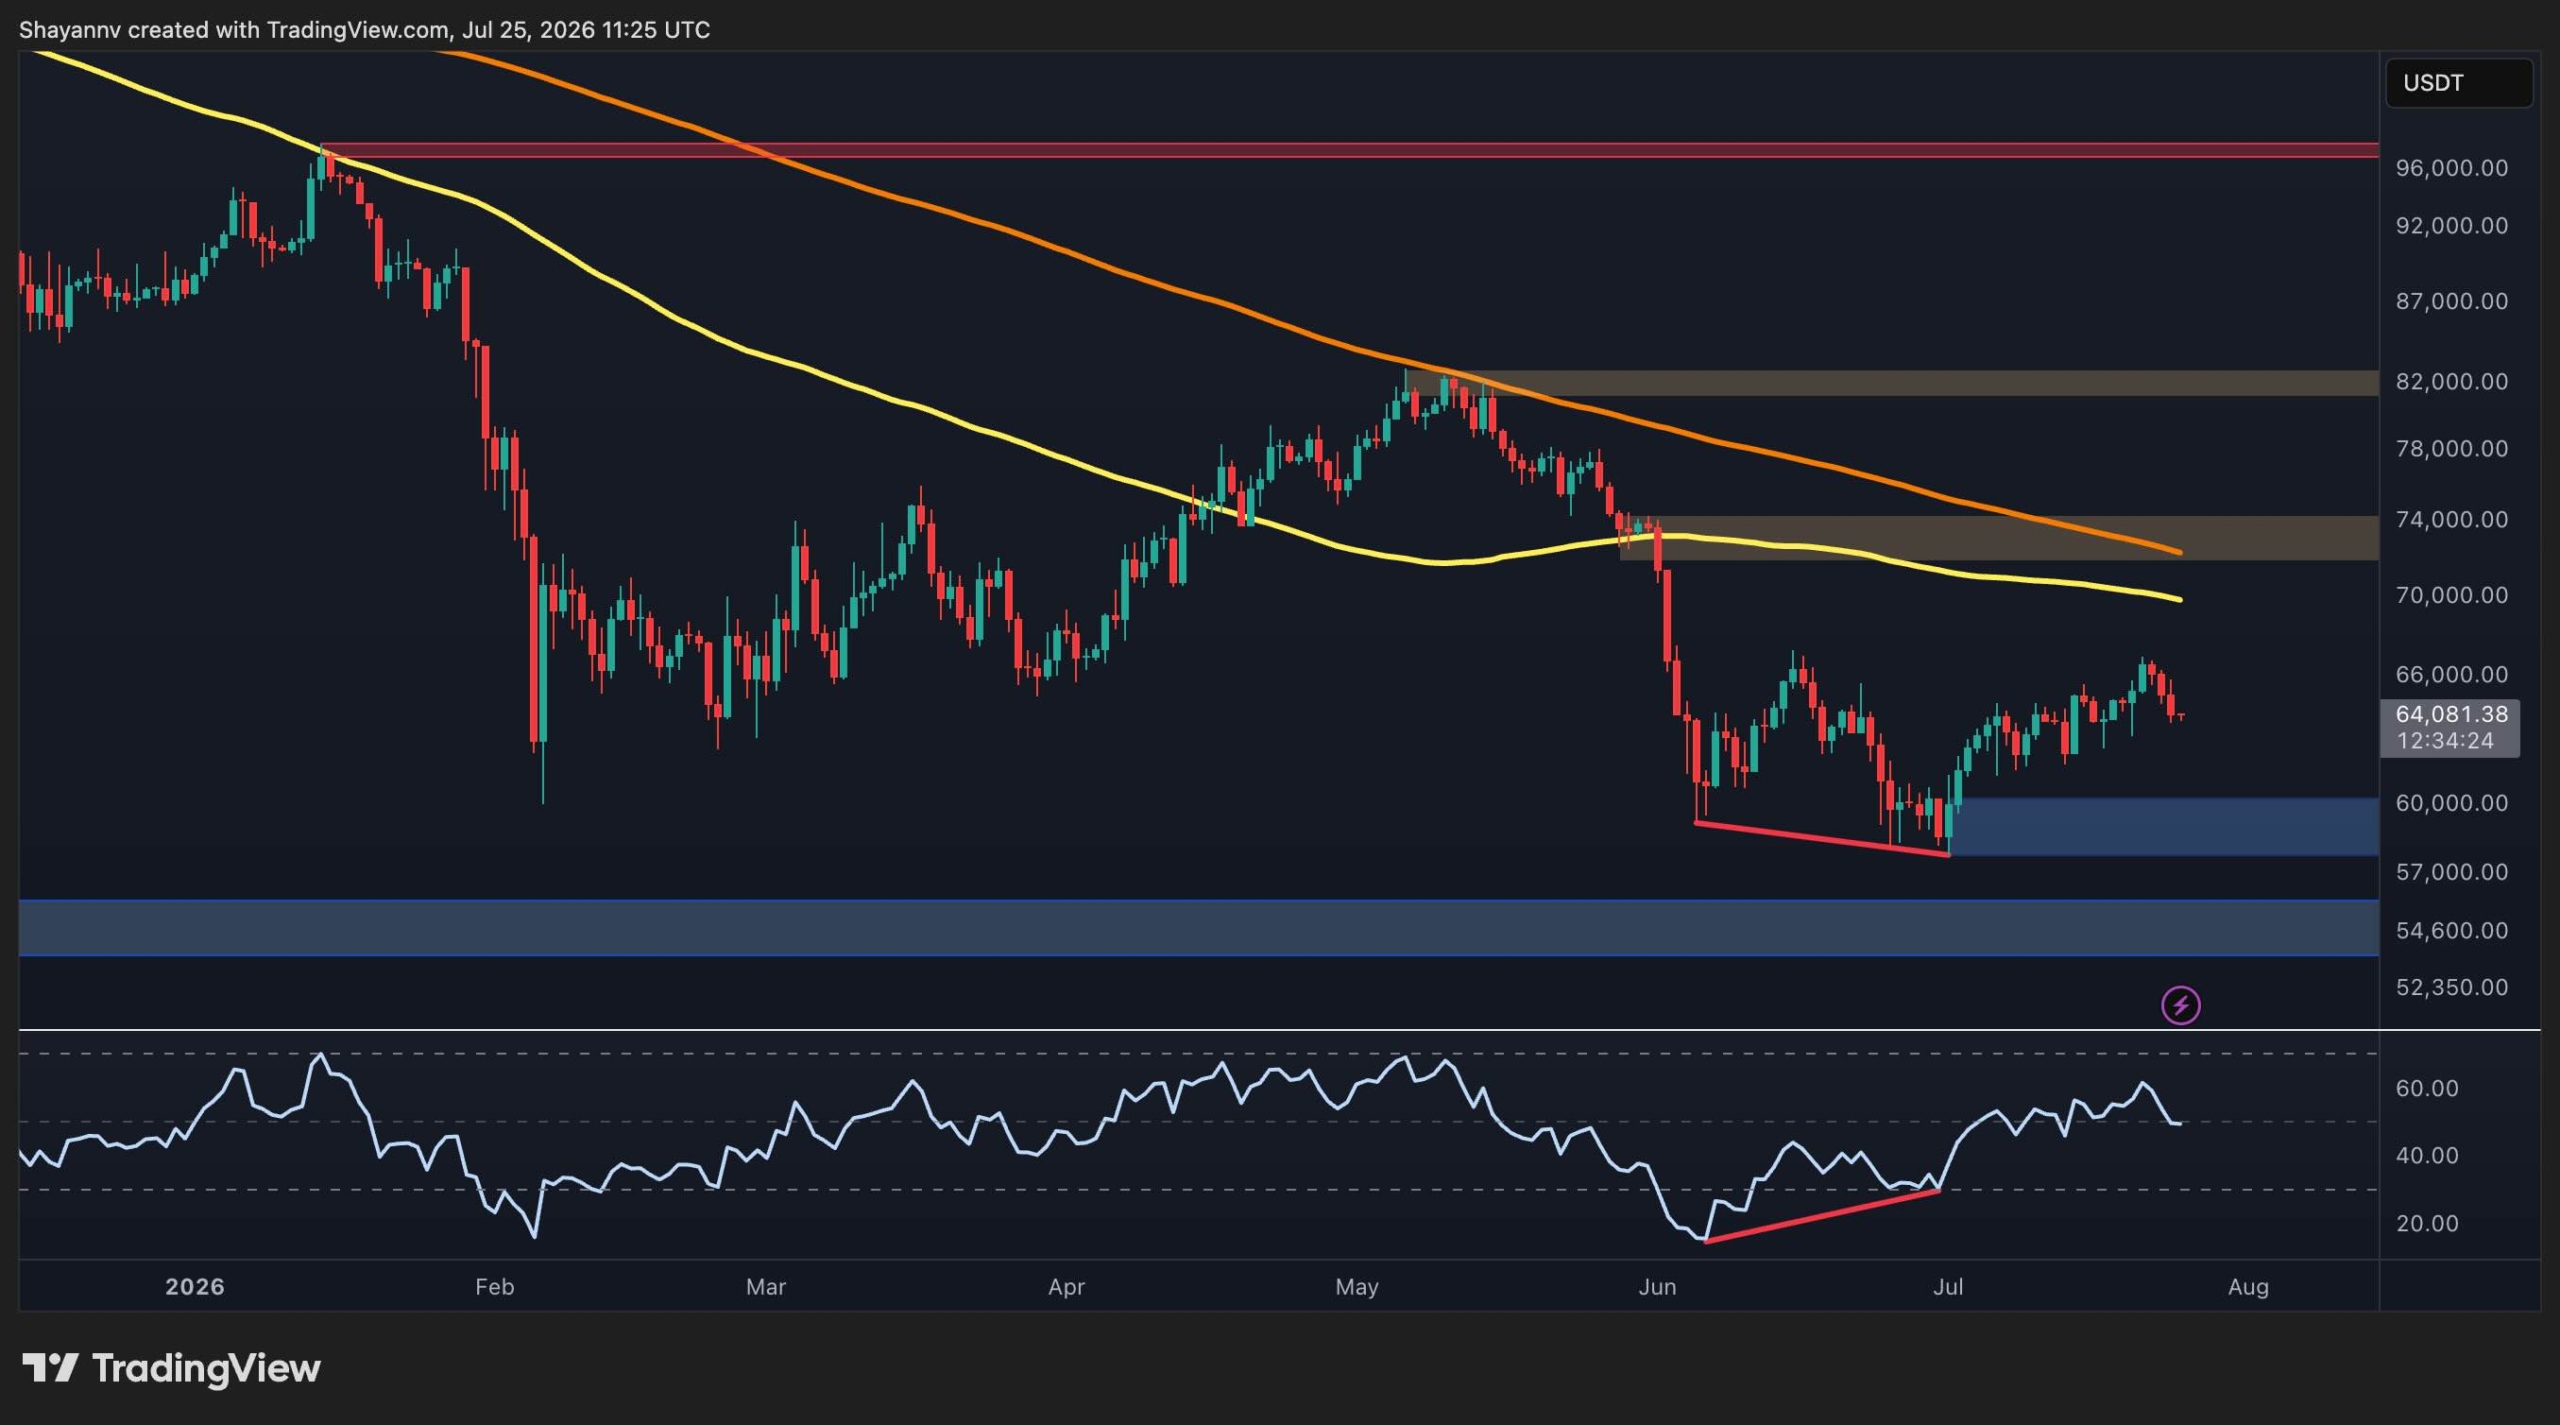
LIVEBitcoin is currently testing the $64,000 level after a volatile start to 2026. While the price has recovered from June lows, it remains stuck under significant resistance zones. On the daily chart, the asset is trapped below both the 100 day and 200 day moving averages, which are currently near $70,000. For a true trend change to occur, Bitcoin needs to secure a steady close above $74,000.
The 4 hour chart shows a more immediate struggle. A recent rising wedge pattern failed, and the price is showing signs of fading momentum. If Bitcoin cannot reclaim the $67,000 area soon, it will likely drift back down toward the $58,000 support floor. Traders should watch these levels closely to see if the recent recovery holds or gives way to further selling pressure.
Interestingly, data on whale order sizes tells a different story than the retail crowd. Large block orders have been active during the recent price drops and subsequent recovery, which often points to institutional accumulation. If these large players continue to buy near resistance, it could support a stronger reversal. However, if retail interest picks up while institutional buying drops off near $74,000, it may signal that the current rally will fail.
Prices update live from CoinMarketCap. Market data, not financial advice.
Market sentiment
Be the first to react
▍Comments (0)
No comments yet. Start the conversation!