Sui Price Stalls Inside Triangle Pattern: Is a Move Coming?
Sui is stuck in a tight consolidation phase as traders wait for a clear direction.

 SUIcoinbeat.news
SUI/USD live chart
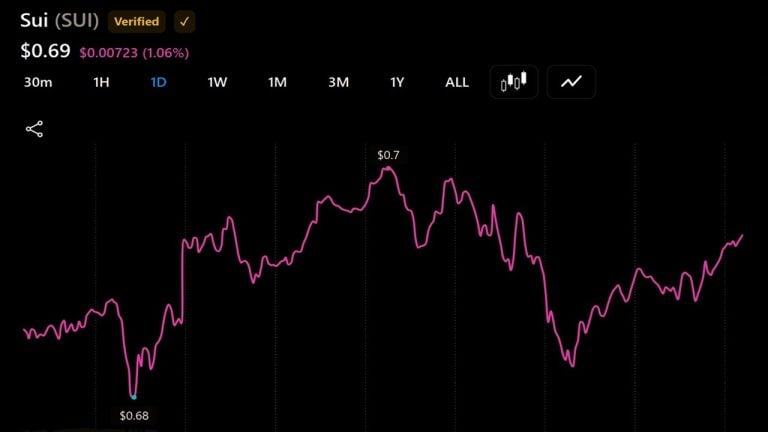
LIVESui is currently changing hands around $0.69 after a quiet period following recent market volatility. The token has struggled to gain momentum over the last month, showing a decline of nearly 10 percent. Frequent selling pressure has prevented the price from breaking through major resistance levels despite a few attempts at a comeback.
On the daily chart, the price action has formed a symmetrical triangle pattern. This shape often signals that a significant move is right around the corner. Because the price is hitting both lower highs and higher lows, the range for trading is getting smaller.
Traders are watching this triangle closely to see which way the breakout goes. A push above the top resistance line could bring back some buyer confidence, while a drop below support might invite more selling. Investors should monitor volume levels to see if the market is ready to pick a side soon.
Prices update live from CoinMarketCap. Market data, not financial advice.
Market sentiment
Be the first to react
▍Comments (0)
No comments yet. Start the conversation!