Is Bitcoin Headed for a Bart Simpson Pattern?
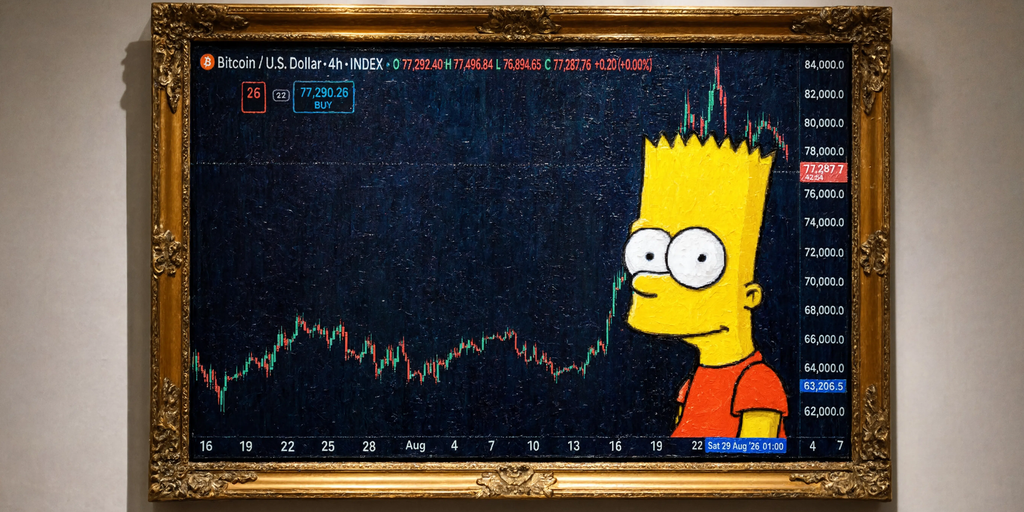
Bitcoin traders are watching for a specific price chart shape that often signals a sudden drop.
 BTCcoinbeat.news
BTC/USD live chart
LIVEBitcoin chart watchers are buzzing about a potential Bart Simpson pattern forming on the charts. This visual setup shows a rapid rise followed by a period of sideways trading and then a sharp drop that mirrors the iconic hairstyle of the cartoon character. Traders often use this pattern to identify when a price spike lacks the momentum to hold its new levels.
While a quick jump can look exciting, it often marks a period of exhaustion for buyers. When the price hits a wall and begins trading sideways, it suggests that sellers are stepping in to take profits. If the price breaks below the support level established during that sideways phase, it often leads to a rapid decline that wipes out the initial gains.
Distinguishing a true crash from a healthy correction is key for investors right now. A correction usually finds support at previous levels before moving higher again. A Bart pattern, however, tends to be more aggressive and suggests that the original move was driven by temporary hype rather than lasting market strength.
Traders are now keeping a close eye on support levels to see if the price can hold or if a sharper drop is coming. If Bitcoin fails to maintain its current range, the market might see a return to lower price zones seen earlier this month.
Prices update live from CoinMarketCap. Market data, not financial advice.
Market sentiment
Be the first to react
▍Comments (0)
No comments yet. Start the conversation!