Is Bitcoin a Safe Hedge? The S&P 500 Correlation Myth
Recent data shows Bitcoin and the S&P 500 have hit a decade low correlation, but experts warn this does not mean the assets act independently.
 BTCcoinbeat.news
BTC/USD live chart
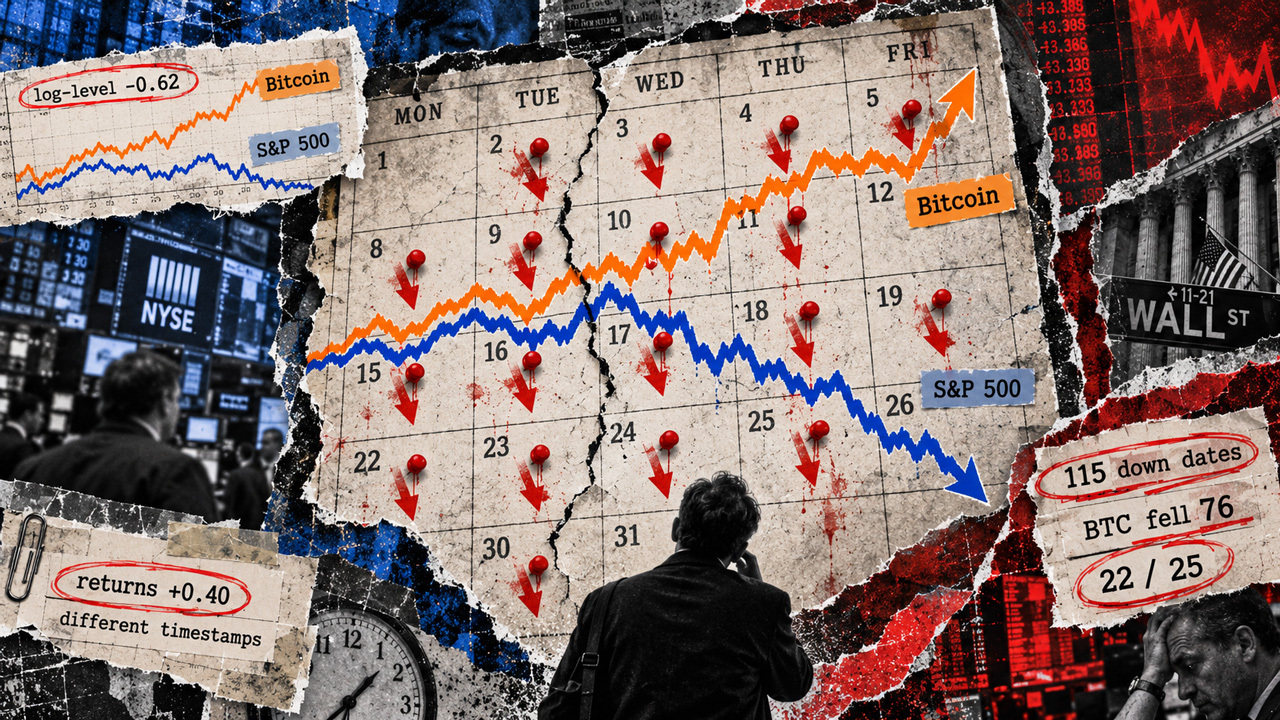
LIVEMany investors believe Bitcoin offers protection when the stock market dips because the two assets often show a negative price correlation. However, recent analysis shows this trend is misleading. While long term price paths may diverge, Bitcoin and the S&P 500 frequently post losses on the exact same days. Tracking the relationship between these two markets depends heavily on whether you measure total price paths or daily percentage returns.
The confusion stems from two different ways of looking at the data. A log level analysis measures how price trends move over months, which currently suggests a negative correlation. Yet, when you look at daily returns, the two assets often move in lockstep. Because these statistics measure different behaviors, a low correlation over a year does not guarantee that your portfolio will remain stable during a stock market sell off.
Testing a sample portfolio shows that adding Bitcoin can actually increase short term volatility rather than lower it. In scenarios where the S&P 500 experienced significant drops of over 2 percent, Bitcoin failed to provide a buffer and instead suffered consistent losses alongside equities. This indicates that while the assets may drift apart over time, they often crash together.
Investors should be cautious when relying on correlation charts for risk management. These metrics change based on the time frame chosen and do not account for how assets react during actual market panics. The evidence suggests that holding Bitcoin alongside stocks may not offer the safety net many traders expect during times of high market stress.
Prices update live from CoinMarketCap. Market data, not financial advice.
Market sentiment
Be the first to react
▍Comments (0)
No comments yet. Start the conversation!