Ethereum Faces Critical Battle at Key Price Levels
Ethereum is caught between buyers and sellers as it trades in a narrow range near important support zones.
 ETHcoinbeat.news
ETH/USD live chart
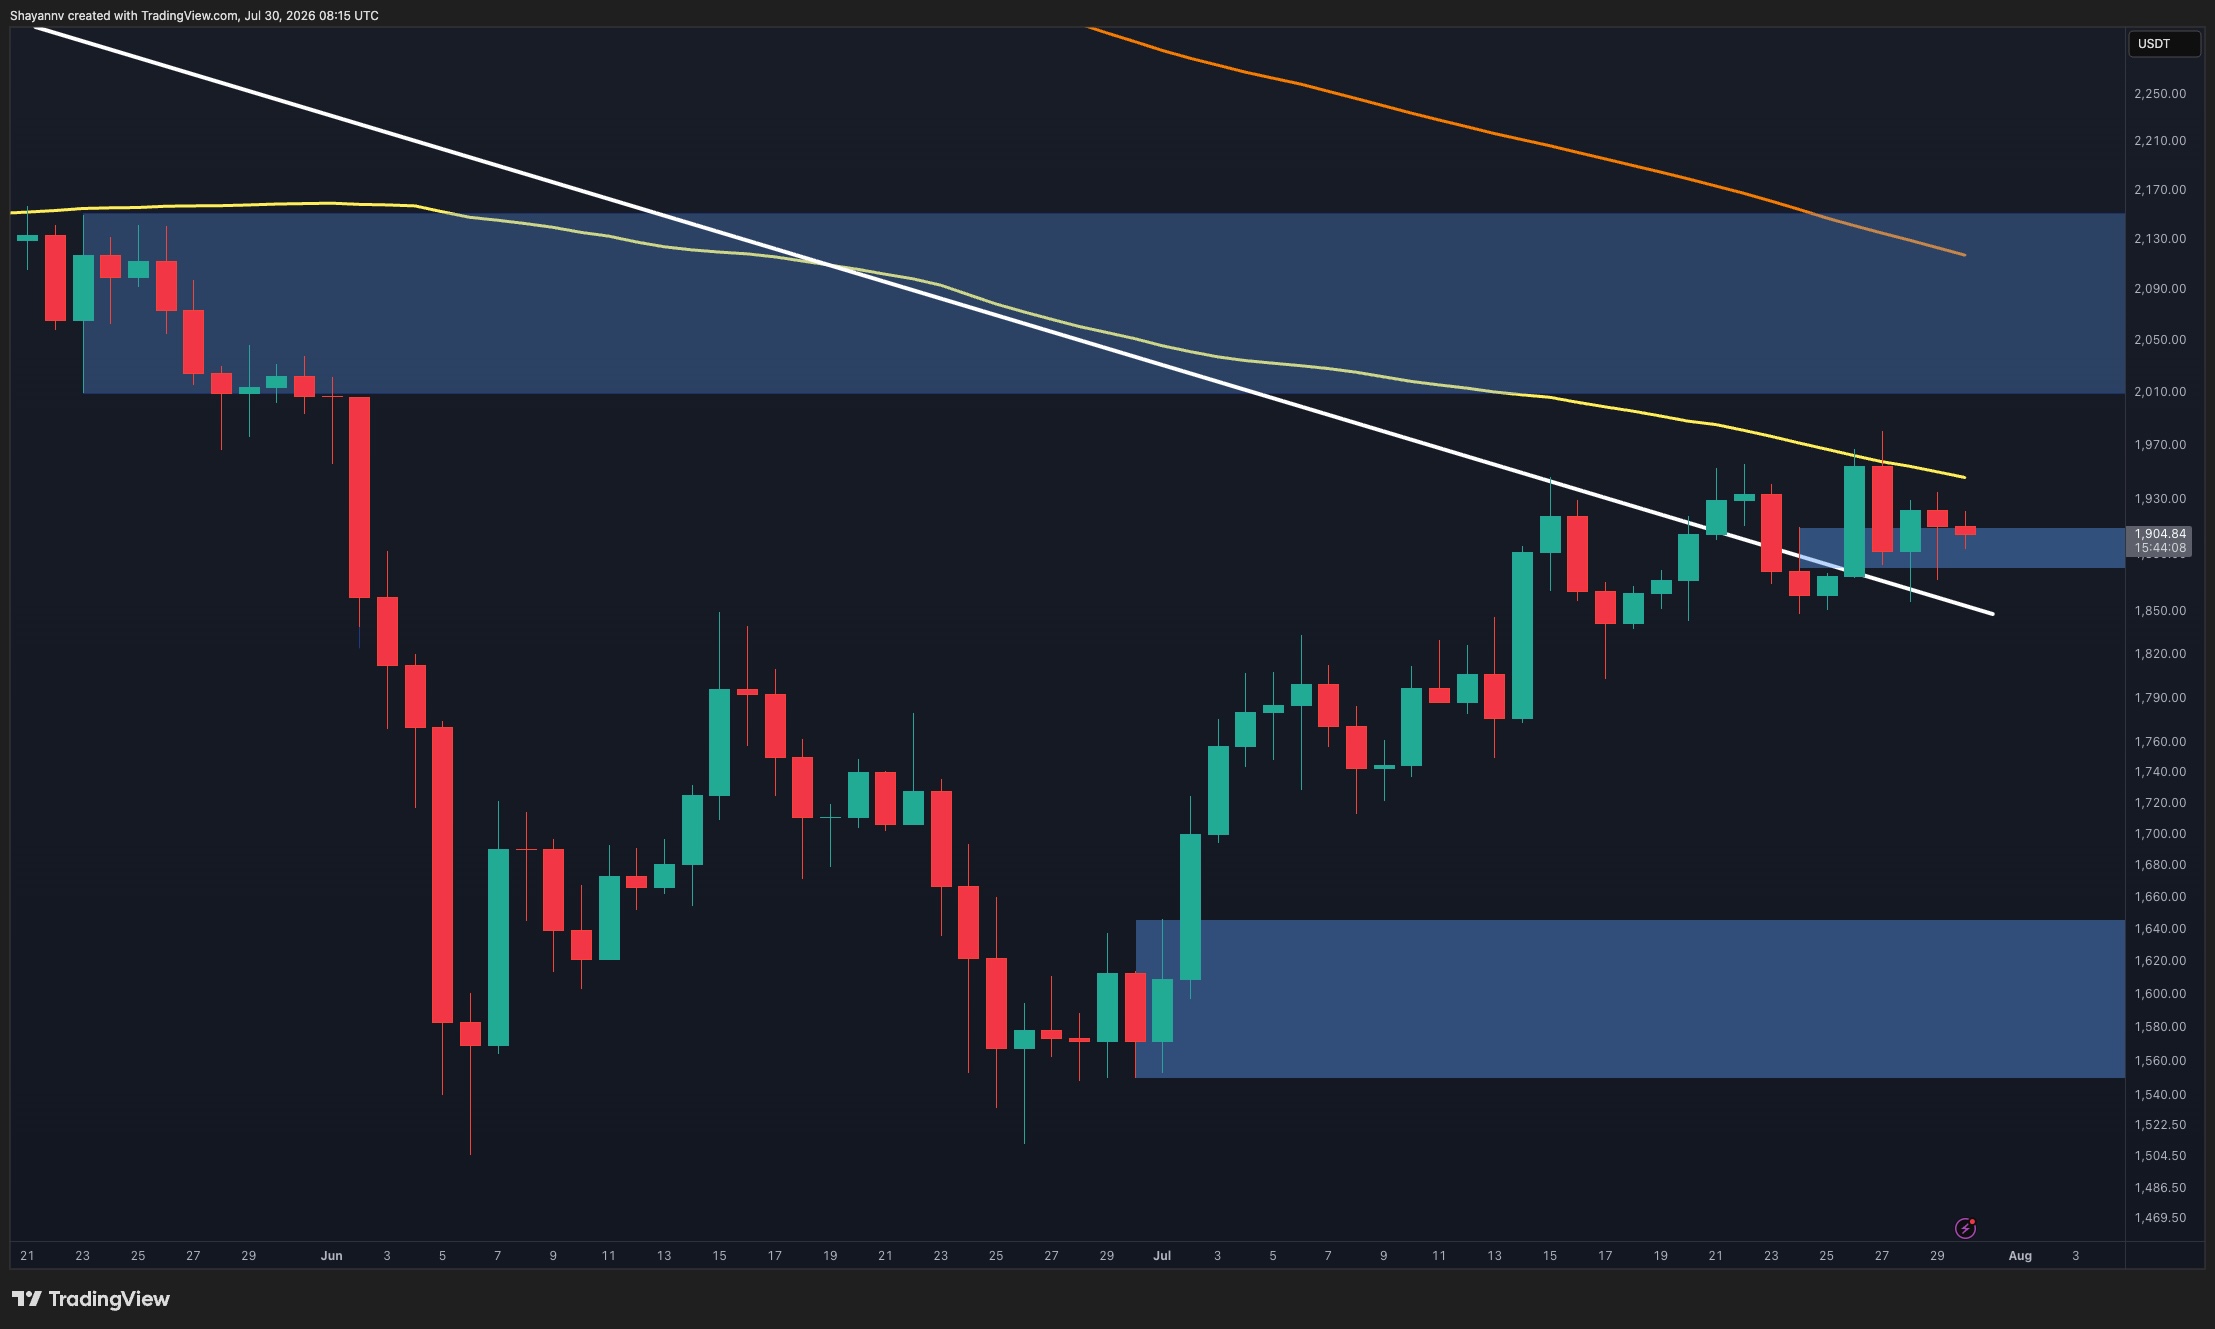
LIVEEthereum is currently stuck in a technical standoff. After a strong recovery from June lows, the price is struggling to maintain upward momentum as it hits resistance near the 1.900 dollar mark. On the daily chart, ETH remains below the 100 day and 200 day moving averages, which highlights a cautious broader trend.
Short term trading on the 4 hour chart shows a compression pattern. This indicates that investors are uncertain about the next direction. For the bullish case to continue, Ethereum needs to break above the resistance zone and the descending trendline. If the price fails to hold the current support level, we could see a slide toward the 1.750 dollar to 1.790 dollar area.
Market data shows a heavy concentration of liquidation orders near the 2.000 dollar level and the 1.820 dollar region. This suggests that the price might remain choppy while the market clears these liquidity clusters. Traders should watch these levels closely, as a move toward either zone will likely spark a spike in volatility.
Prices update live from CoinMarketCap. Market data, not financial advice.
Market sentiment
Be the first to react
▍Comments (0)
No comments yet. Start the conversation!