Bitcoin Price Faces Major Test at $66K Resistance
Bitcoin is approaching a critical zone that will decide if the current recovery continues or turns back toward lower support levels.
 BTCcoinbeat.news
BTC/USD live chart
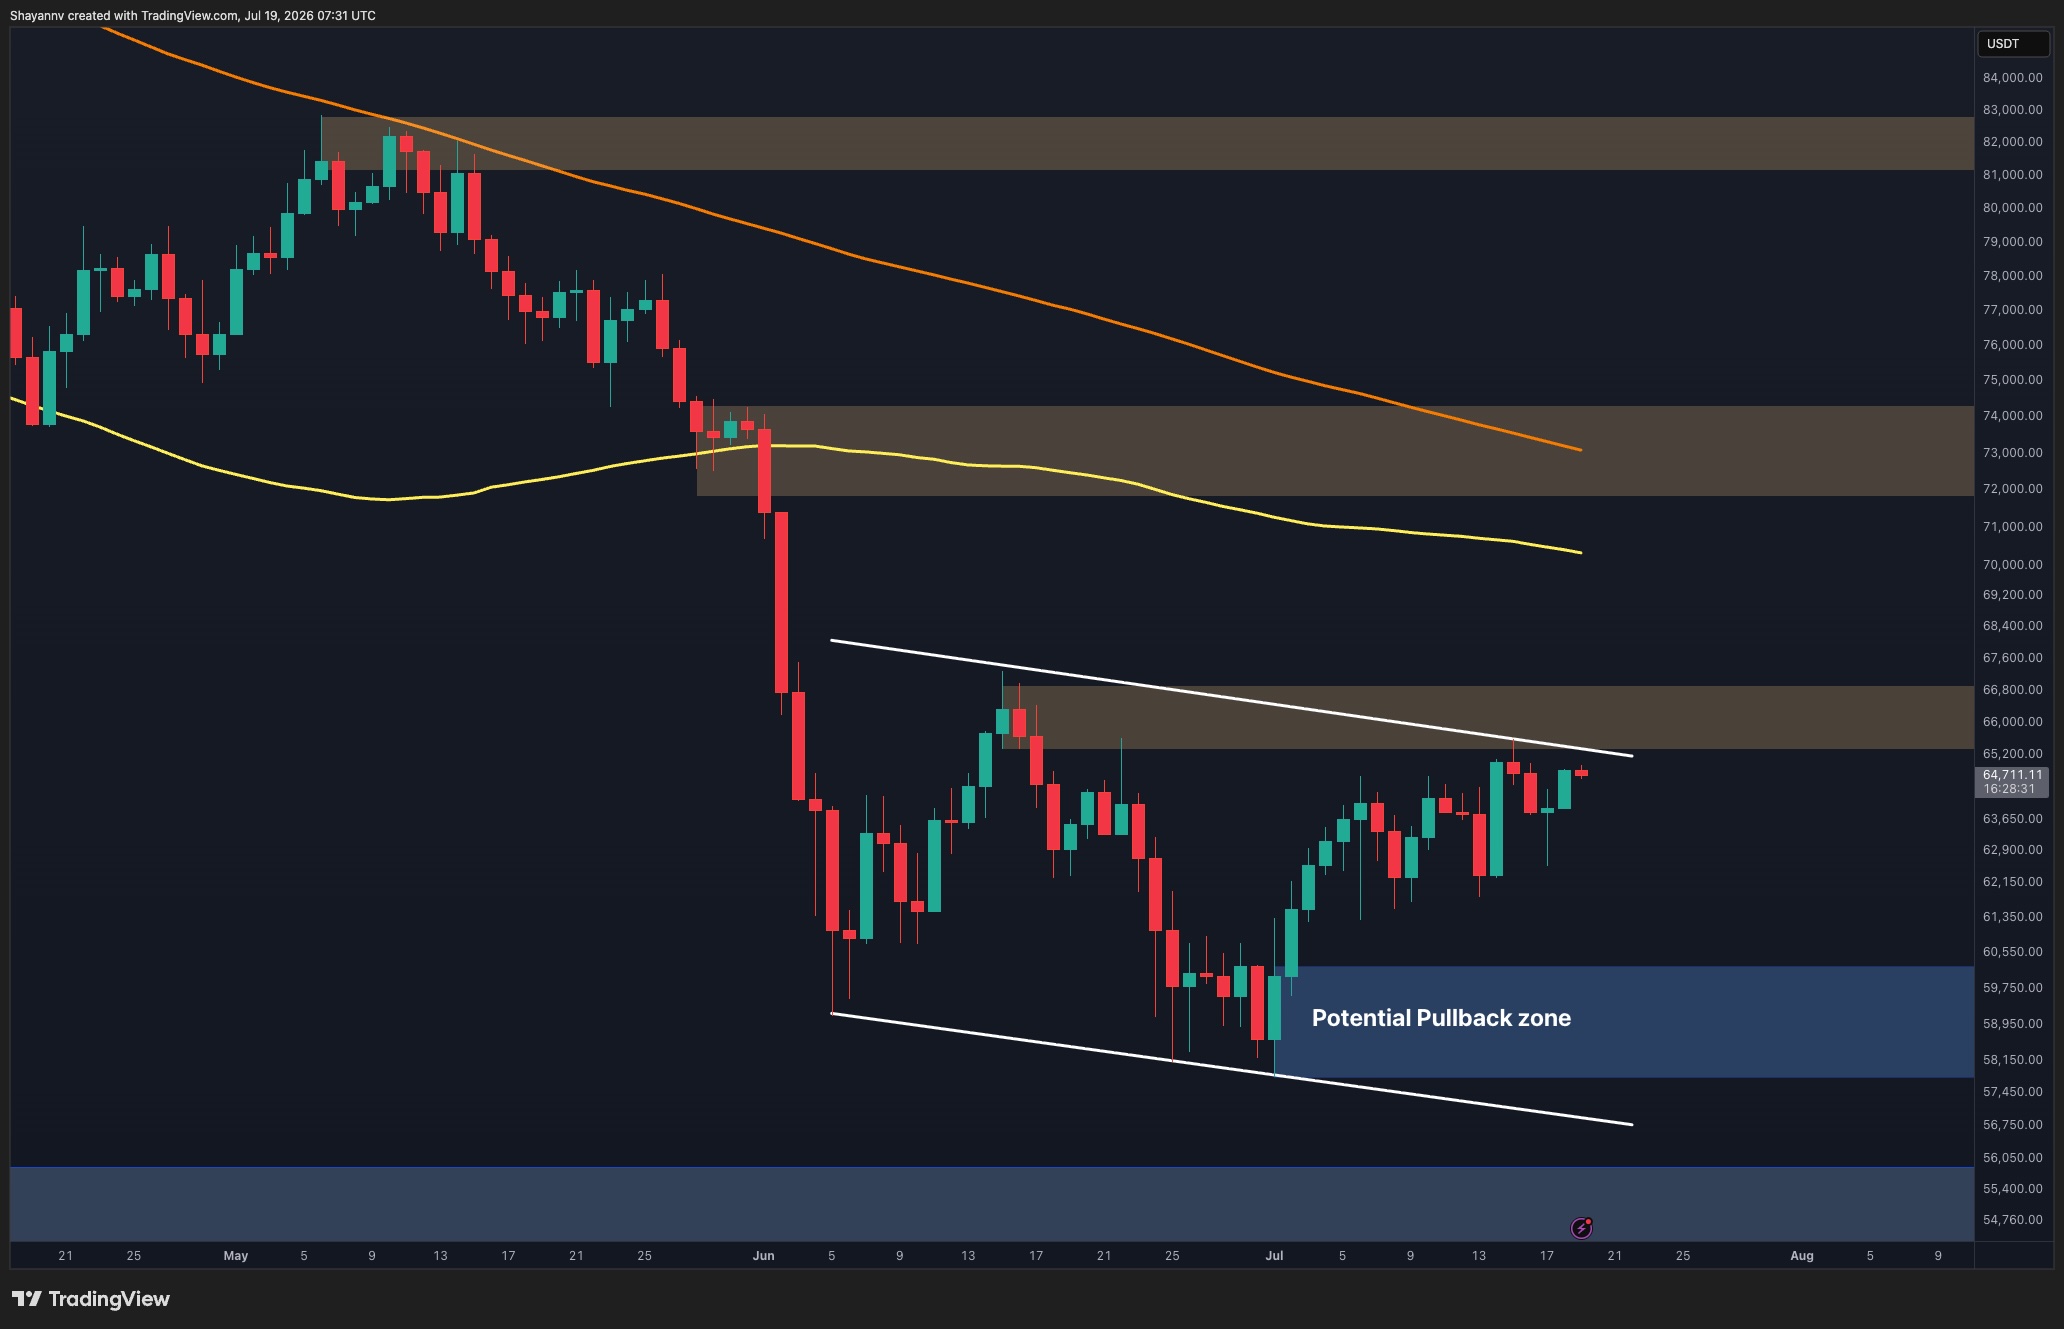
LIVEBitcoin is showing signs of recovery following the June market dip, but it is currently hitting a wall. The price is stuck below the 100 day and 200 day moving averages, which keeps the overall trend leaning toward the downside for now. Traders are watching the $65,000 to $66,500 zone closely, as this area sits right at a long term trendline that has rejected previous price jumps.
On the 4 hour chart, Bitcoin is trading inside a rising channel. While buyers have managed to hold onto higher lows lately, the coin is now testing the upper edge of that channel. If Bitcoin can break through the $66,500 resistance, it could clear the path to test the $72,000 range. If it fails to break through, the price may drop back to support levels between $58,000 and $60,000.
Market data shows that many recent buyers are still holding at a loss. The cost basis for people who bought in the last few months sits near $70,000, which is currently above the market price. This suggests that the current movement is still a relief rally rather than a full market turnaround. Watching how the price reacts to the $61,000 support level over the coming days will be key to understanding the next move.
Prices update live from CoinMarketCap. Market data, not financial advice.
Market sentiment
Be the first to react
▍Comments (0)
No comments yet. Start the conversation!