Bitcoin Hits Bullish Signal on Weekly Charts
A key volatility indicator just flipped green for the first time in months, suggesting the recent Bitcoin rally has staying power.
 BTCcoinbeat.news
BTC/USD live chart
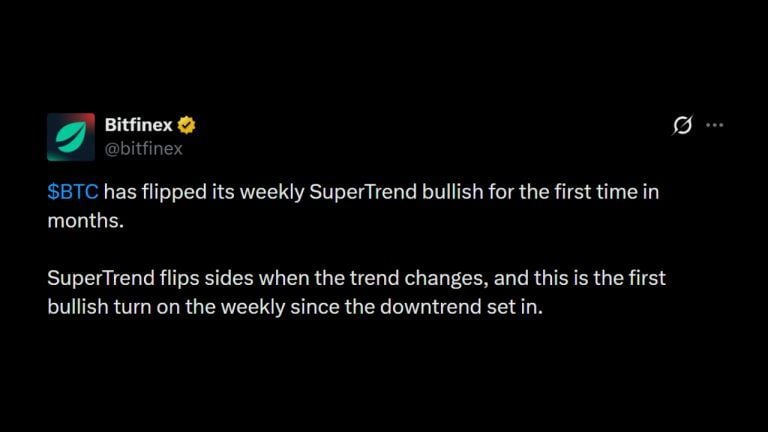
LIVEAnalysts at Bitfinex spotted a major shift in the weekly Super Trend indicator. This technical tool tracks price volatility to identify market direction. For the first time since the long downtrend began, the indicator has turned positive. This suggests that the current upward movement is not just a temporary spike but a potential change in the long term trend.
While Bitcoin has seen some jumpy price action lately, this signal provides a clearer look at the bigger picture. When the Super Trend indicator moves into positive territory, it often suggests that buying momentum is growing strong enough to sustain a rally. Traders look for these signs to confirm if a recovery is actually taking hold.
Investors should keep an eye on how the price reacts to this news in the coming days. A shift on the weekly chart carries more weight than daily movements, but the market still needs to hold these gains to prove the bears are truly losing their grip.
Prices update live from CoinMarketCap. Market data, not financial advice.
Market sentiment
Be the first to react
▍Comments (0)
No comments yet. Start the conversation!