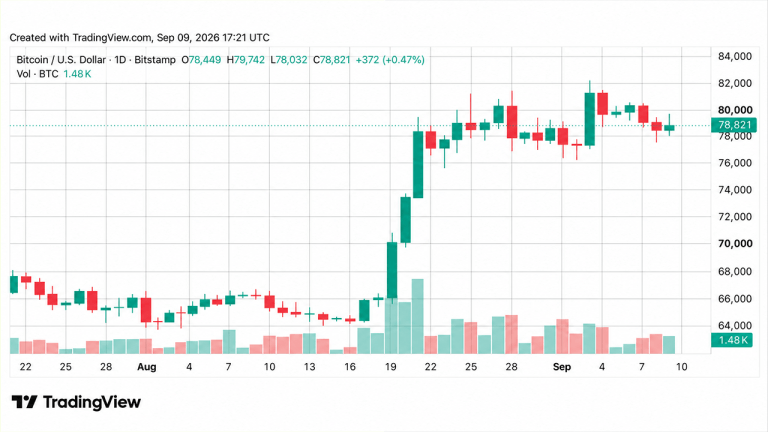
Bitcoin Flashes Golden Cross, Is the Bear Market Done?
Bitcoin has hit a key daily bullish signal, but analysts suggest waiting for a weekly trend shift before celebrating.

 BTCcoinbeat.news
BTC/USD live chart
LIVEBitcoin has just hit a classic golden cross on its daily chart. This happens when the 50 day moving average climbs above the 200 day moving average. It is the first time we have seen this setup since November 2025, and historically, it often points to a significant price rally ahead.
Despite the excitement, market analysts are urging caution. While the daily chart looks bright, the weekly chart remains the true test for long term trends. Bitcoin is currently sitting above its 200 week moving average, which is a positive sign, but it has yet to reclaim the 50 week moving average. Historically, reclaiming that 50 week level is what separates a short term bounce from a real, sustained bull market.
Investors face a classic dilemma here. Waiting for the price to break above the 50 week moving average offers much stronger proof that the bear market is over, but it also means buying in at a higher price after the initial move. For now, traders are watching to see if Bitcoin can turn these key weekly levels into support to confirm the trend is finally turning in their favor.
Prices update live from CoinMarketCap. Market data, not financial advice.
Market sentiment
Be the first to react
▍Comments (0)
No comments yet. Start the conversation!