Bitcoin Hits Key Resistance at $65K as Bulls Test Momentum
Bitcoin is testing a critical price ceiling that will determine if its recent recovery is a true trend reversal or just a temporary bounce.
 BTCcoinbeat.news
BTC/USD live chart
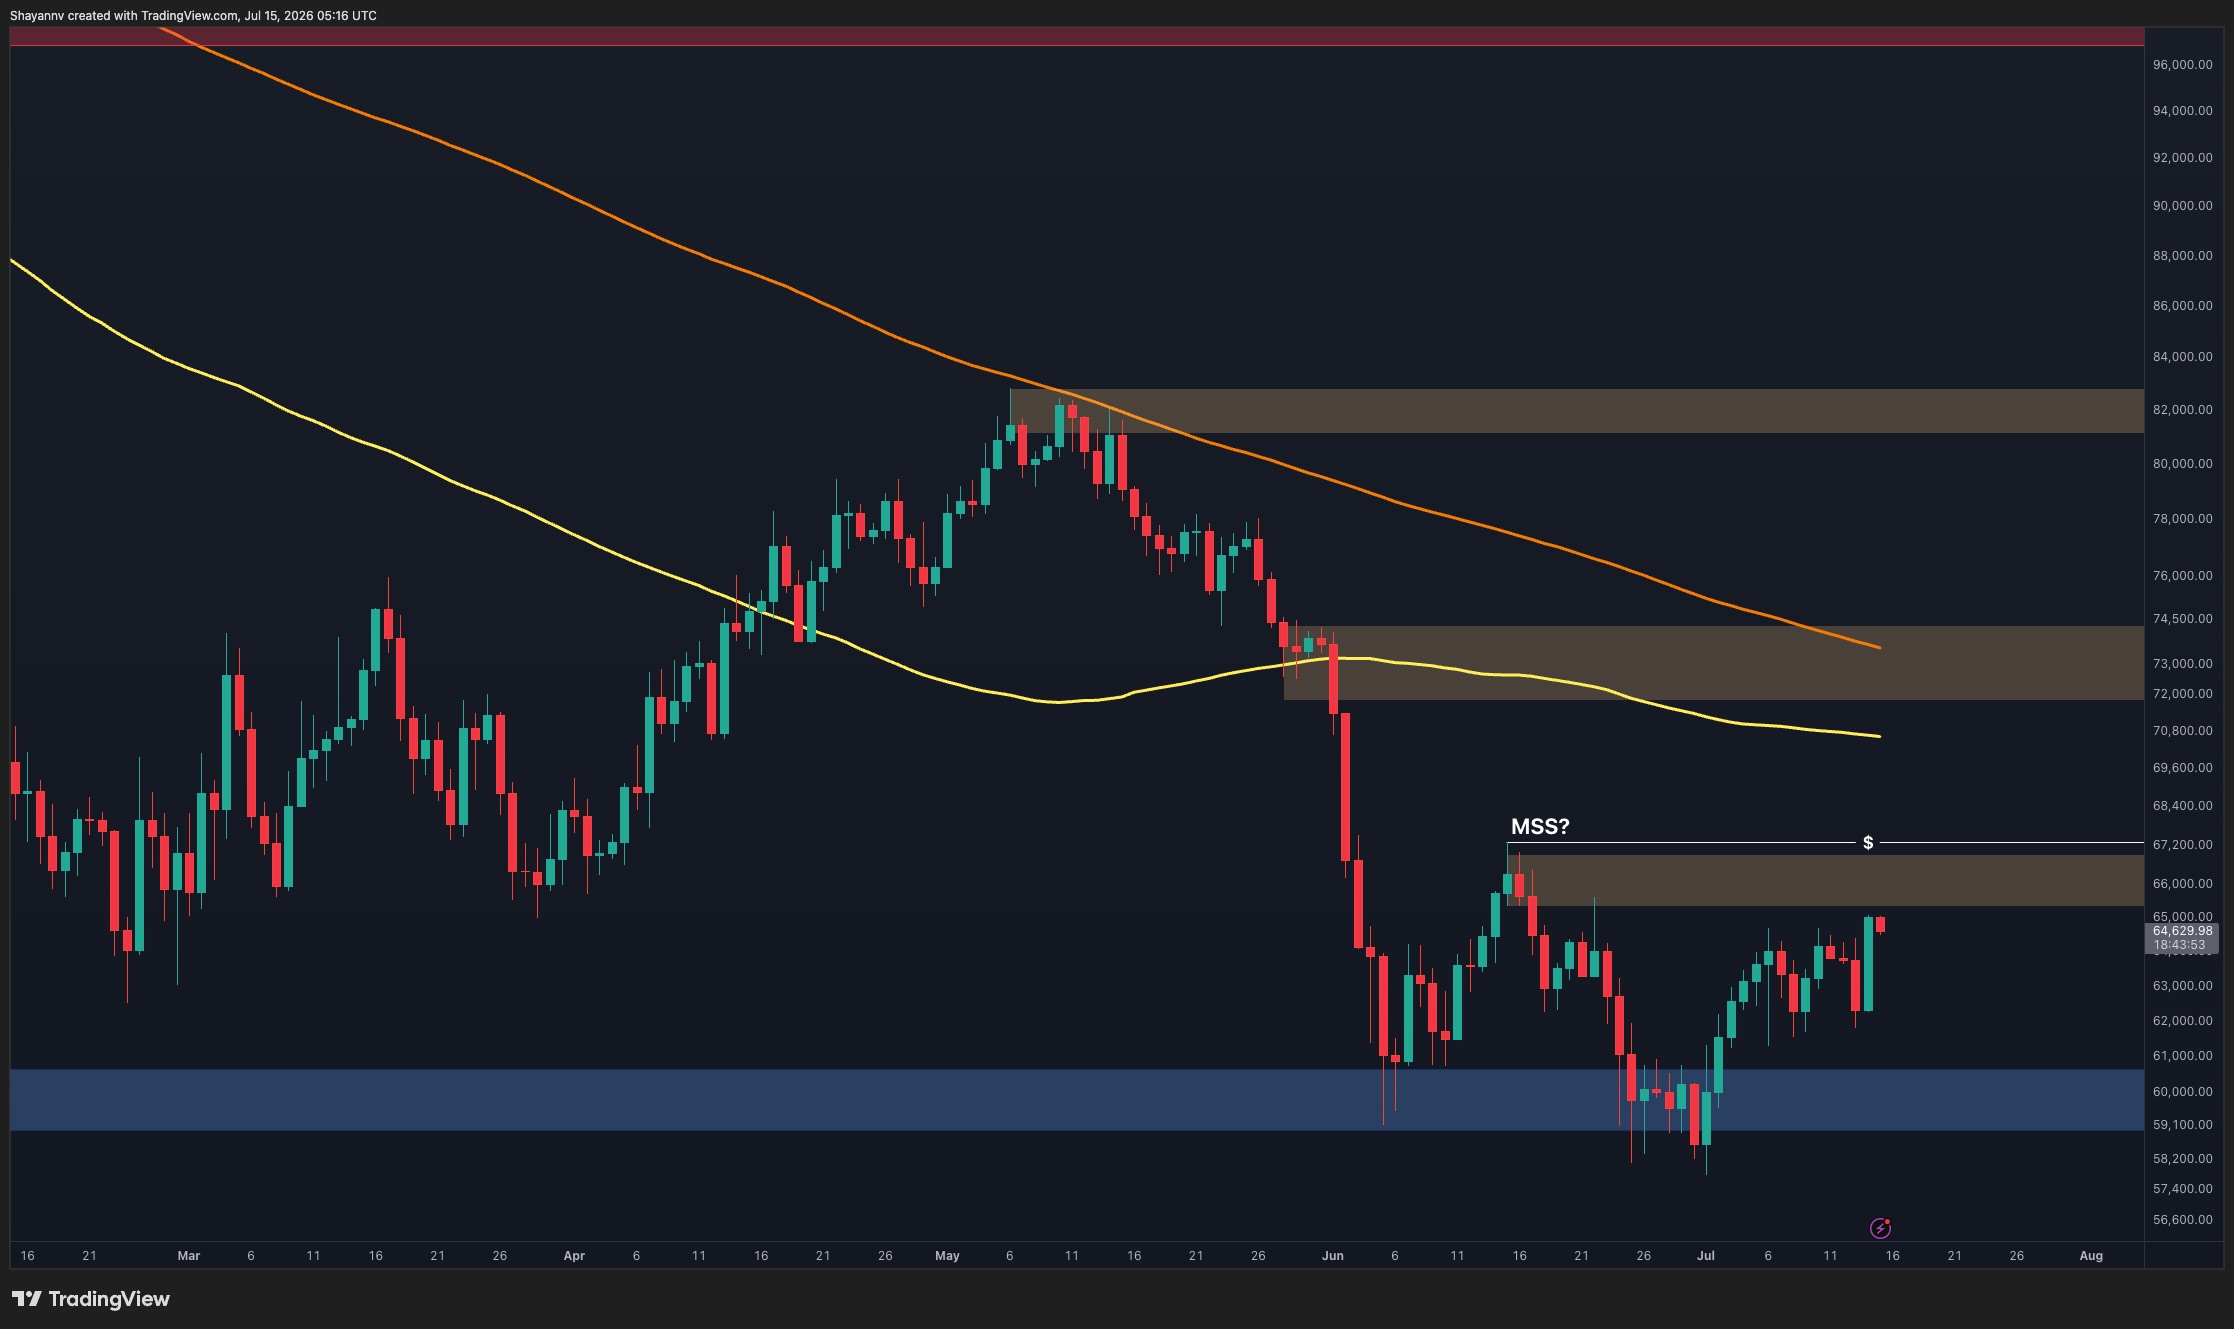
LIVEBitcoin is making waves again as it pushes toward the $65,000 mark. After climbing back from support levels near $58,000, the asset is now facing a major supply zone between $65,000 and $67,000. Traders are watching this area closely because it represents a significant hurdle that must be cleared to shift the current bearish trend toward a more bullish outlook.
On the daily chart, Bitcoin still sits below its 100 day and 200 day moving averages. While the 4 hour chart shows a more optimistic trend with higher lows and solid support at $61,000, the price is now hitting a convergence of resistance. If Bitcoin can successfully break past $67,000, the next target for buyers sits near the $72,000 to $74,000 range.
Data on recent trade activity offers some encouragement. We are seeing larger spot orders coming into the market, which suggests that bigger investors are accumulating assets rather than just retail traders driving the price. This shift in behavior is a positive sign for the structural health of the recovery.
Despite these signals, the market is not out of the woods yet. A rejection at the current $65,000 level could send the price back down toward the $61,000 support zone. For now, the best strategy is to watch how Bitcoin handles this immediate resistance, as a clear breakout is needed before we can confirm a sustained move upward.
Prices update live from CoinMarketCap. Market data, not financial advice.
Market sentiment
Be the first to react
▍Comments (0)
No comments yet. Start the conversation!